 Xpense
When people feel like they're overspending but can't point to why, it's almost never one big purchase they can blame. It's usually a pattern spread across dozens of small transactions that each looked completely reasonable in the moment. You don't notice a pattern from inside it — you need something to actually show it to you, laid out, before it becomes obvious.
1. Small, frequent purchases don't feel like spending
A ₹300 food delivery order doesn't register as a financial decision the way a ₹3,000 purchase does, even though eight of them in a month adds up to the same amount. The psychological cost of a transaction scales with its size, not its frequency — so the category that quietly costs the most is often the one made of purchases too small to each feel worth questioning.
2. Subscriptions you forgot you had
A streaming service, a cloud storage plan, an app subscription started for a free trial two years ago — these auto-debit silently and never show up as a decision you're actively making. They're easy to miss specifically because nothing about the moment of charging asks for your attention.
3. Category creep
Spending in one category slowly rises over months without any single month looking alarming. ₹8,000 on dining out becomes ₹9,500, then ₹11,000, each step small enough to not register — until you compare this month to six months ago and the gap is obvious in a way no single month's number revealed.
4. The gap between tracked and actual
If you're tracking manually and some purchases slip through — a cash payment, a UPI transfer you forgot to log — your tracked total quietly understates reality. Over a few months that gap compounds, and "I'm staying within budget" stops being true in a way your own numbers won't show you.
5. No visibility into the trend, only the total
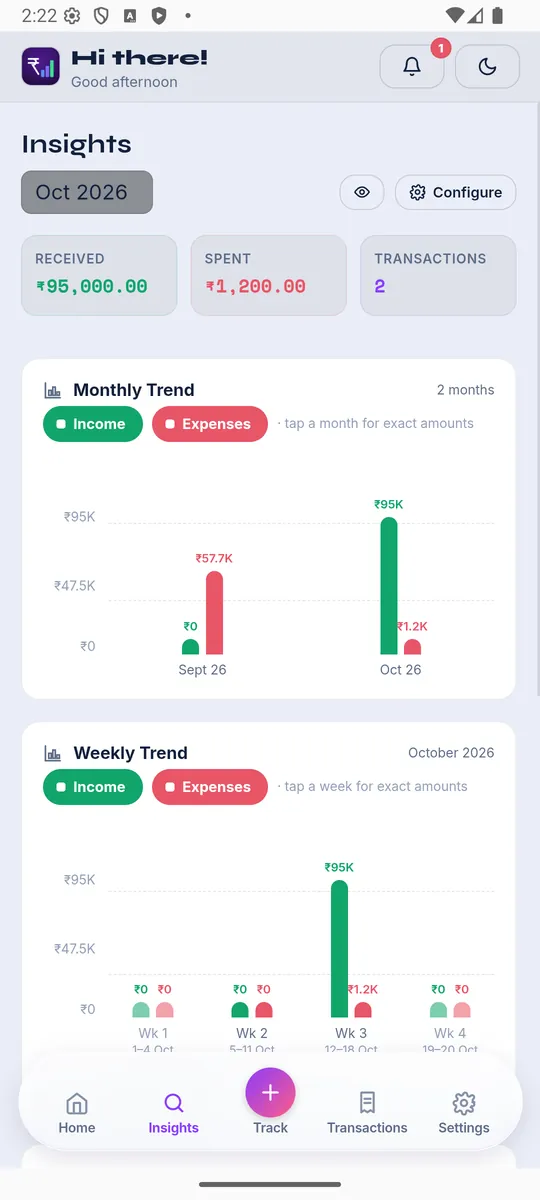
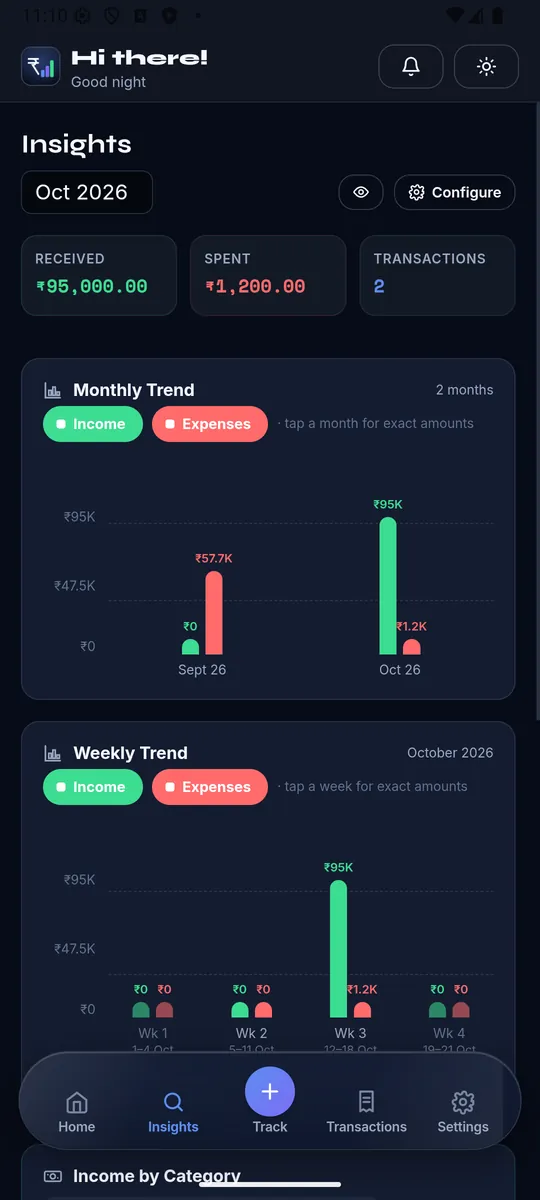
Knowing you spent ₹45,000 this month tells you almost nothing on its own. Knowing you spent ₹38,000 last month and ₹32,000 the month before — now you can see the direction, not just the number. Most budgeting stops at "did I stay under my limit," which misses the trend entirely.
What actually surfaces this
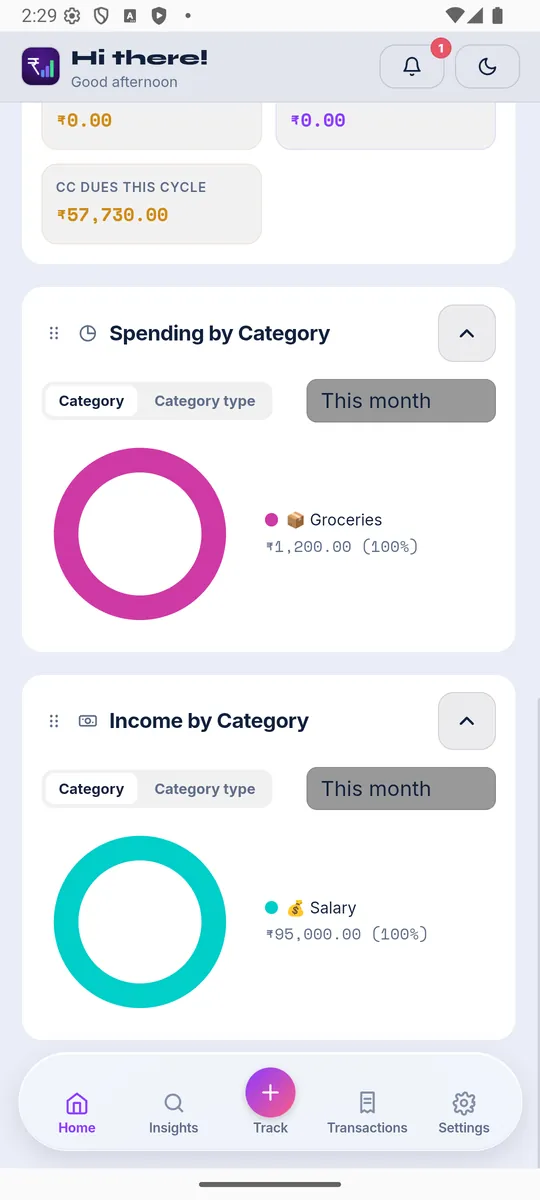
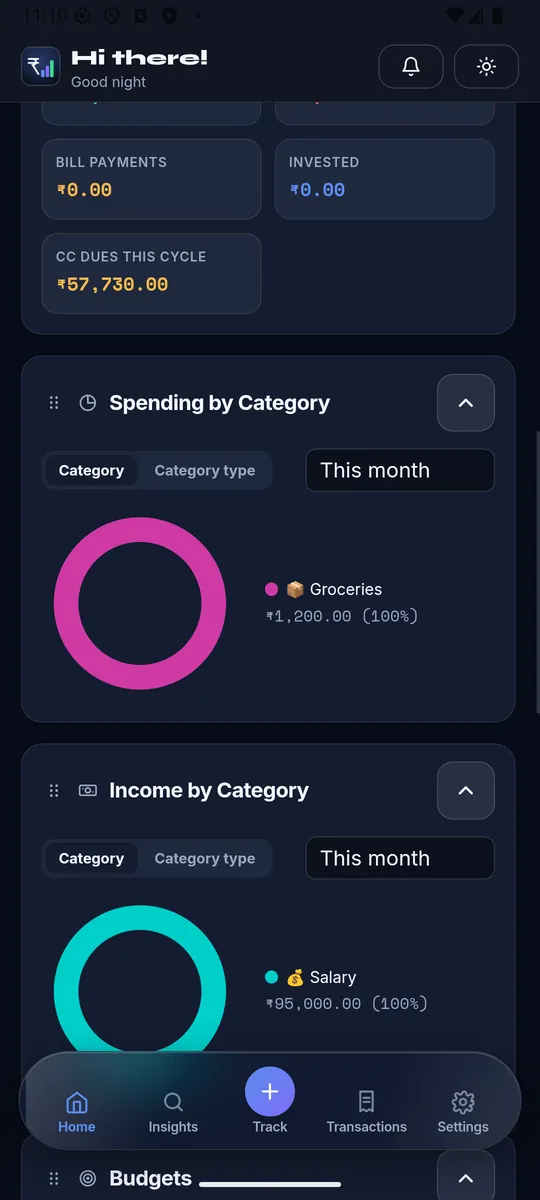
Every one of these reasons has the same fix: a chart, not a number. A category-by-category breakdown you can glance at monthly catches creep before it's a crisis. A month-over-month trend line catches direction before a single month's total does. A full, automatic record (not one with gaps from forgotten cash entries) catches the subscriptions you forgot and the small purchases you didn't register as spending at all.
XpenseAI's Insights tab breaks down spending by category with month-over-month trend charts, and flags when a category is tracking over its usual pace — before the month ends, not after. See exactly how it works or get started free.